Calculating Naive Bayes with Excel Numeric Data Attributes
Assalamualaikum, Greetings to all of you and cultural greetings.
Okay ..., in this discussion I will give you experience on how to calculate Naive Bayes using Microsoft Excel in the case of numeric or continuous data attributes.
Before you want to calculate Naive Bayes using Excel, you must understand more about the basic concept of calculating the Naive Bayes algorithm in the case of numerical data or you can read it in Calculating Naive Bayes Continuous Data Attributes.
If you already understand the basic concept of calculation, we will also be able to calculate it using excel formulas. In Microsoft Excel we will use the COUNTIF, STDEV and AVARAGE function formulas. And Immediately, we start at the earliest stage, namely data preparation.
1. Data Preparation
First do a filter based on the class. Here I will give an example by filtering two classes, namely (Graduated and Dropout). How to activate is first. Block Class column layout, then select the Sort & Filter menu and select Filter. Next, in the class column, select the filter icon and select a class to filter.
2. Calculate AVERAGE VALUE
In the next calculation concept, we will calculate the mean or average value of each attribute based on the class. In our example, we will calculate the average value of the attribute Number Of Courses with Graduate class conditions, the formula is
= AVARAGE (Block Column, Number Of Courses) then ENTER. Another note we have to create a separate AVERAGE table in order to differentiate for the calculation. Example:
The table above is the calculation result of the average value based on the class which we have filtered in the number one stage earlier.
3. Compute Standard Deviation.
Next, we calculate the standard deviation value of each attribute based on the class. And the standard deviation formula is as follows
How do we apply in excel formulas? the answer has been provided by Microsoft by providing easy features, features or standard deviation formulas, there are two parts, namely. STDEV.S and STDEV.P. Are all the functions the same or different?
- STDEV.S, is the condition of the argument is a sample from the population
- STDEV.P, is a condition in which the argument is to calculate the entire population
In this case we will use STDEV.S because what we are counting is each attribute from the entire population.
Also Read: Rapidminer Tutorial Using the Naive Bayes Algorithm
Just like point number two, create a table to distinguish the attributes of the graduated class and the dropout class. In our example we will calculate the standard deviation value of the Number of Courses attribute. then calculate the standard deviation with the formula
= STDEV.S (Block attribute number of courses) then ENTER. And do this for each attribute.
The table above is the calculation result of the standard deviation value based on the class that we filtered in the number one stage earlier.
4. Calculate the Probability of Each Class
Next is to calculate the probability or probability value of each class. Here we will use the COUNTIF and COUNTA formulas. What we calculate the probability value is no longer the filtered data but the original data or the data before we filter it. and We write the formula to calculate the probability value of the Graduated class
= COUNTIF (Class Column attribute block; "Graduate" / COUNTA (Class Column attribute block)
then ENTER. And for Dropout class attribute we just change "Graduate" to "Dropout".
The table above is the result of the probability value of each class.
5. Calculate the Gaussian Value.
The Gaussian distribution is the final step to find out the results of training data, or a data test model by taking the value of probability from the training data. The formula is as follows:
Next, we will try to calculate the value of the test data whose class is not yet known
First, calculate the Gaussian distribution of each class, namely the graduate and dropout classes
If calculating from the graduated class, we must take from the mean value, the standard deviation of the graduated class which has been differentiated from points one and two. In the example we will calculate the value of the gaussian distribution of the attribute Number of Courses for the class graduated. Write the formula like this
= 1 / SQRT (2 * 3.14 * standard deviation Number of Courses in Graduated Class) * EXP (- ((54 - Average Value of Number of Subjects in Graduated Class) ^ 2 / (2 * standard deviation Number of Courses in Class graduated ^ 2))) then ENTER
do that formula for each attribute. And for the gaussian distribution of the dropout class, replace it with the value of the dropout class.
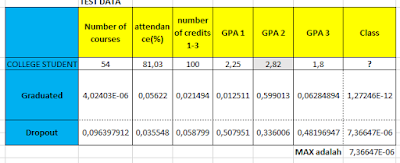
After calculating from the attribute Number of Courses to GPA 3, the final step is to multiply all variables by the probability value of each class or four points.
The method is = 4.02403E-06 * 0.05622 .................. * 0.06284894 * Graduated class probability value)
then Enter and if the class is dropout then replace it with the dropout class probability value.
Then the results of each class are shown in the table in the class column above.
Find the Maximum value. And there the maximum value is obtained from the results of the Gaussian Distribution for the dropout class.
Then the test data from students with the number of courses = 54, attendance = 81.03%, the number of credits 1-3 = 100, GPA 1 = 2.25, GPA 2 = 2.83, GPA 3 = 1.8
in the prediction of the Naive Bayes algorithm with class results is DROPOUT.


